
Free
Try the tools, no commitment
$0/ month
1 asset
- Liquidity Zones — one edition
- Trend Background
- Trendometers for one asset
- Updates group and open Discord
Start free with one asset. Higher plans add coverage, deeper analysis and planning tools.
Try the tools, no commitment
The core tools, on your assets
More assets, deeper analysis and trade planning
The complete system: analysis, planning and risk management before and during the trade
Launch pricing, USD · Monthly billing · Cancel anytime · Full refund within 14 days, no cancellation fee
Exposure: the positioning of PurplEdge systems, not a trading instruction. Each prop firm sets its own rules on coordinated trading and trade copying; check them before you act.
What’s included in each plan, in detail ↓
Payment runs on PurplEdge's secure checkout. Indicator access usually opens within 15 minutes.
Each plan builds on the one before it. Click Details for a short explanation and a demo video.
Swipe sideways to see all plans
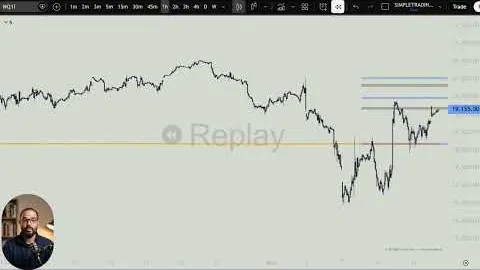
Marks key liquidity zones on your chart that often act as decision areas: a reference for entry and exit, across all asset classes.
 Watch the demo (opens YouTube)
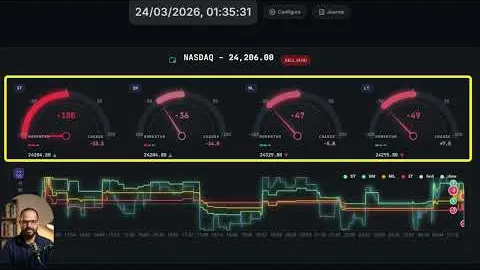
Real-time visual gauges for trend direction and strength, across several timeframes at once.
 Watch the demo (opens YouTube)
Marks key liquidity zones on your chart that often act as decision areas: a reference for entry and exit, across all asset classes.
Watch the demo (opens YouTube)Trend detection with dynamic background colouring and potential reversals: real-time directional context, tuned per asset, for analysis.
 Watch the demo (opens YouTube)
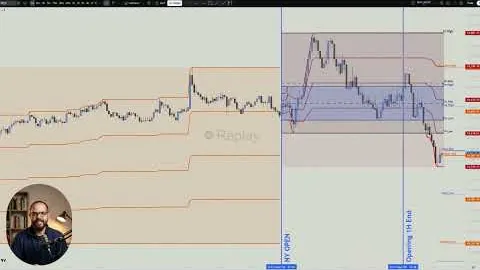
Shows the Asian, London and New York sessions on your chart, so you know when the high-volatility windows open.
 Watch the demo (opens YouTube)
Real-time visual gauges for trend direction and strength, across several timeframes at once.
Watch the demo (opens YouTube)Marks key liquidity zones on your chart that often act as decision areas: a reference for entry and exit, across all asset classes.
Watch the demo (opens YouTube)Map entry, target and stop-loss levels you set with TrendScore and Trade Stations, and get an alert when your own conditions are met. For analysis and planning, not signals.
 Watch the demo (opens YouTube)
Real-time visual gauges for trend direction and strength, across several timeframes at once.
Watch the demo (opens YouTube)Marks key liquidity zones on your chart that often act as decision areas: a reference for entry and exit, across all asset classes.
Watch the demo (opens YouTube)Map entry, target and stop-loss levels you set with TrendScore and Trade Stations, and get an alert when your own conditions are met. For analysis and planning, not signals.
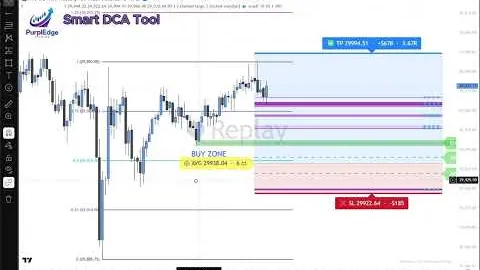
Watch the demo (opens YouTube)Set the amount you are prepared to risk; the tool splits the trade into 2 to 5 entries and shows each entry size in advance.
 Watch the demo (opens YouTube)
Shows the Asian, London and New York sessions on your chart, so you know when the high-volatility windows open.
Watch the demo (opens YouTube)Real-time visual gauges for trend direction and strength, across several timeframes at once.
Watch the demo (opens YouTube)Swipe sideways to see all plans
| Included | Free | Explorer | Advantage | Master |
|---|---|---|---|---|
| Assets in Trendometers | 1 | 6 | 12 | All available assets |
| Liquidity Zones editions without alerts | 1 | 3 | 6 | 6 |
| Trend Background | One asset | 6 assets | 12 assets | All available assets |
| TrendSurfer · Session Mapping · BOS Box · True Opens | — | ✓ | ✓ | ✓ |
| BOS Box MTF · HTF Gaps · Institutional Trade Stations · Consistent Trader | — | — | ✓ | ✓ |
| Trade Planner | — | — | One asset | All assets supported by the tool |
| DCA Risk Manager | — | — | — | ✓ |
| Alert editions of Liquidity Zones and Session Mapping | — | — | — | ✓ |
| AI-supported community analysis | — | Concise | In-depth | In-depth |
| Exposure channels | — | 1 | 4 | 8 |
Market-analysis tools: indicators that add information to your TradingView chart, trend gauges in your browser, and a community for learning and discussing analysis. Higher plans add risk-planning tools and alerts.
No coding is needed. You should understand the basics of trading and its risks. Start with the Free plan, read the explanations and ask the community before adding more tools.
The tools show trend and price-level information and support trade planning. You assess the information and decide whether to act. This is not a buy/sell instruction service or a promise of results.
Yes, that is who we built them for: prop traders trading a funded account. You can analyze markets in TradingView and your browser. Check that each tool or connection is compatible with your firm’s rules and account type.
Add indicators to charts in your TradingView account. Open Trendometers in your browser. Community analysis is shared on Discord and WhatsApp. The mobile app is in private beta; the team sends the official download link. Trading from the app is coming soon.
Free includes one Liquidity Zones edition, Trend Background, trend gauges for one asset and community access. There is no time limit and no credit card is required. Choose your coverage and edition during onboarding.
Full automation is coming soon as a separate service for prop-firm accounts only. It is not included as an active product in the plans shown here and will never run on customers’ personal capital.
Indicator access opens on the TradingView account you gave us, usually within 15 minutes of payment. Taking longer? Message us on WhatsApp with your TradingView username and we will check.
Yes. Billing is monthly with no lock-in. Change or cancel your plan in your account, under Subscription, or by contacting us. Within 14 days of purchase you get a full refund, with no cancellation fee.
On the sign-in screen, click “Forgot password?” to get a reset link. A short video on the Start free page shows how to find your TradingView username. Still stuck? Write to us and we will help.