Read trends across timeframes
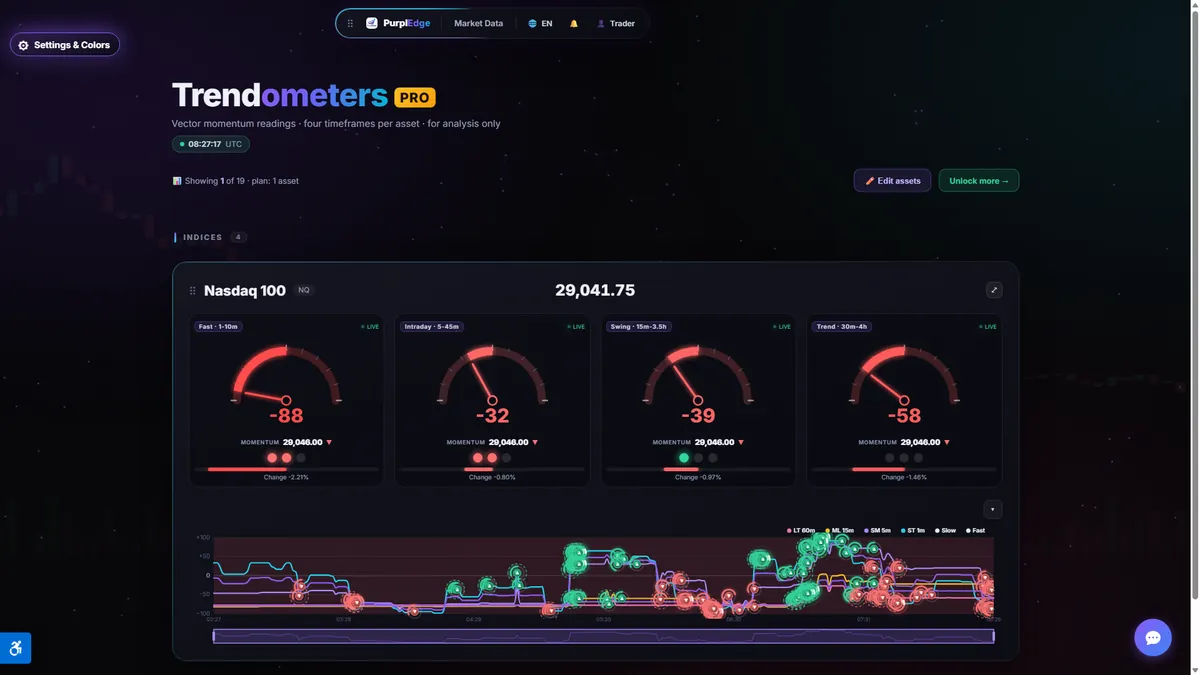
Four gauges per asset display trend direction and strength. Compare shorter-term movement with the broader picture and see when they differ.
Choose by the job you need to do. Each tool explains what it shows, where it runs and which plan includes it.

Four gauges per asset display trend direction and strength. Compare shorter-term movement with the broader picture and see when they differ.

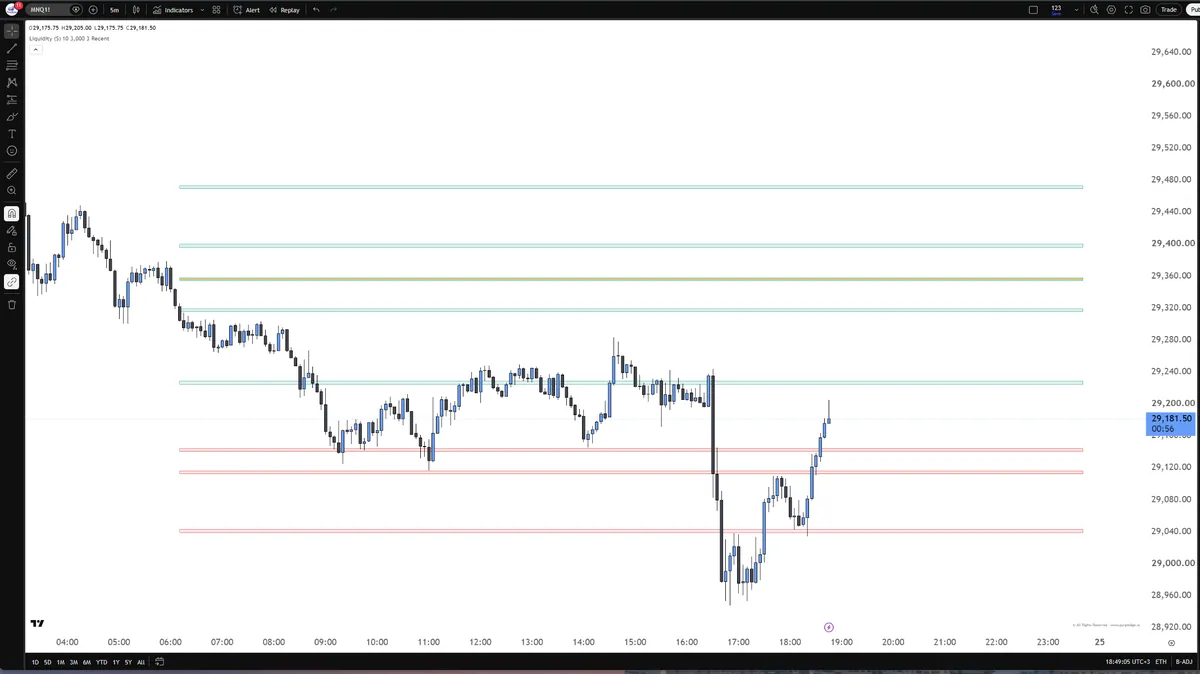
Marks liquidity zones: price areas the analysis identifies as relevant to market activity. Use them as reference points within your own analysis.

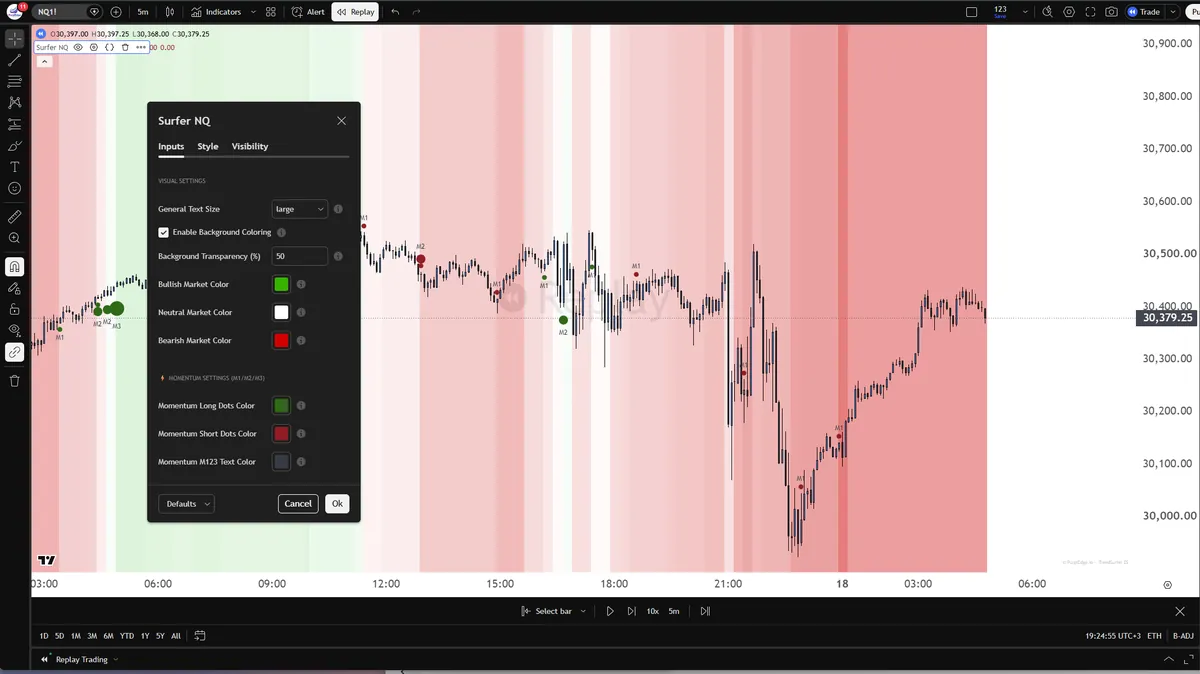
Uses background color and a score to visualize the trend. Momentum markers add context on the strength of movement and changes in it.

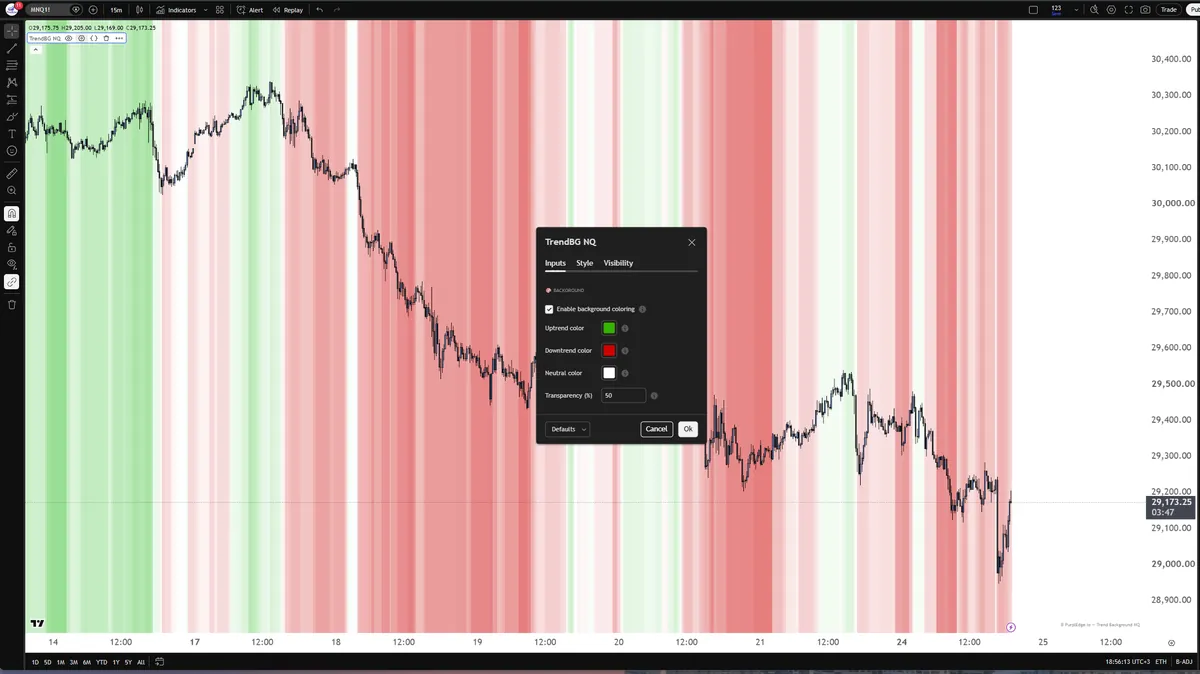
Colors the chart background according to the trend state. See the broader context alongside the candles and price levels you already follow.

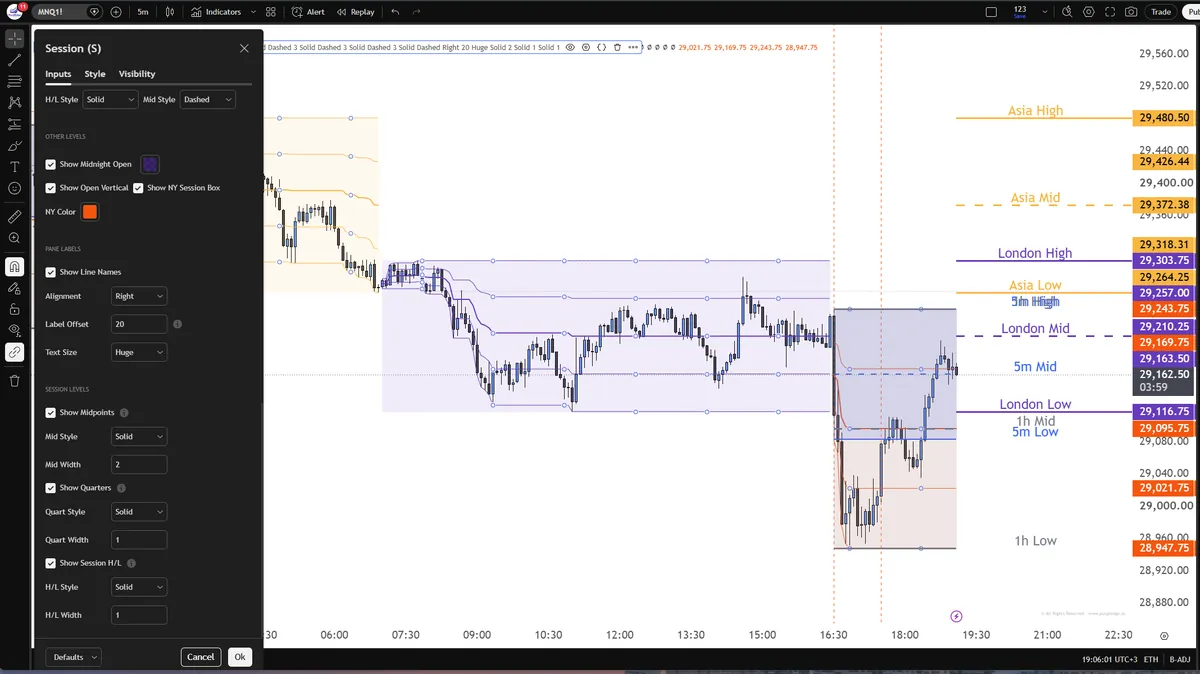
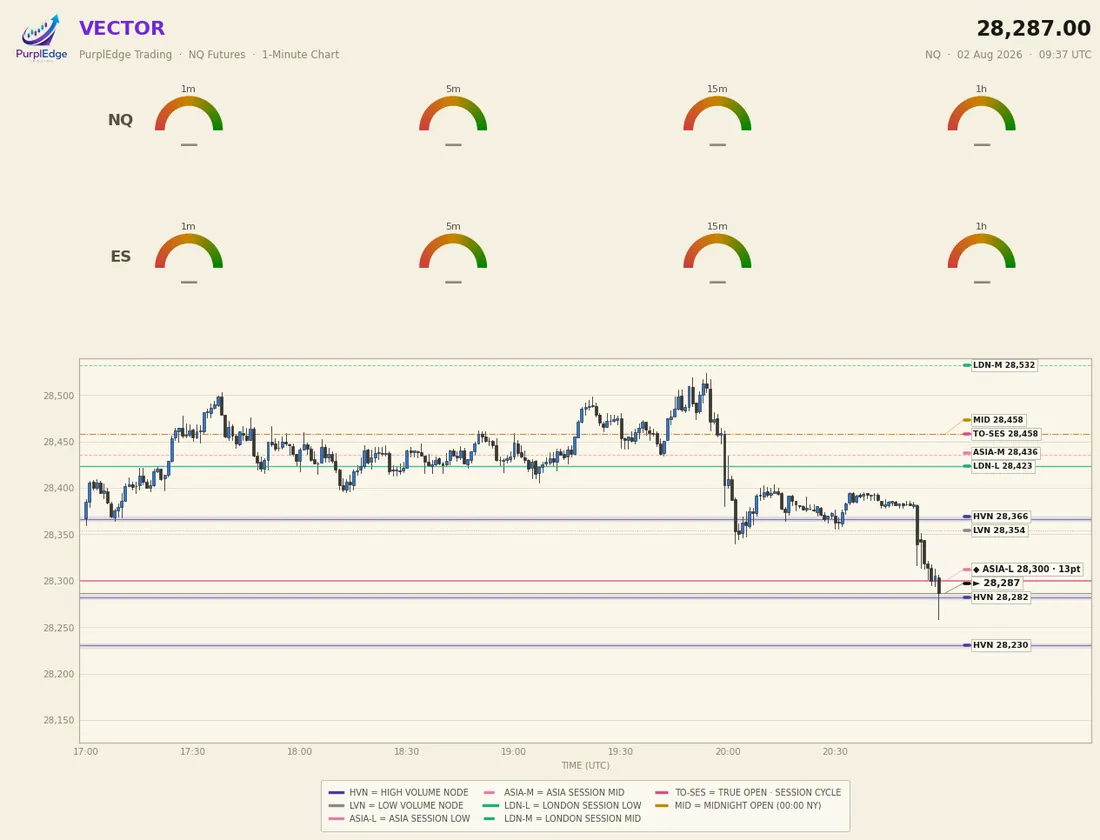
Marks the Asian, London and New York sessions and their price ranges. A session is a period of trading activity in a particular market.

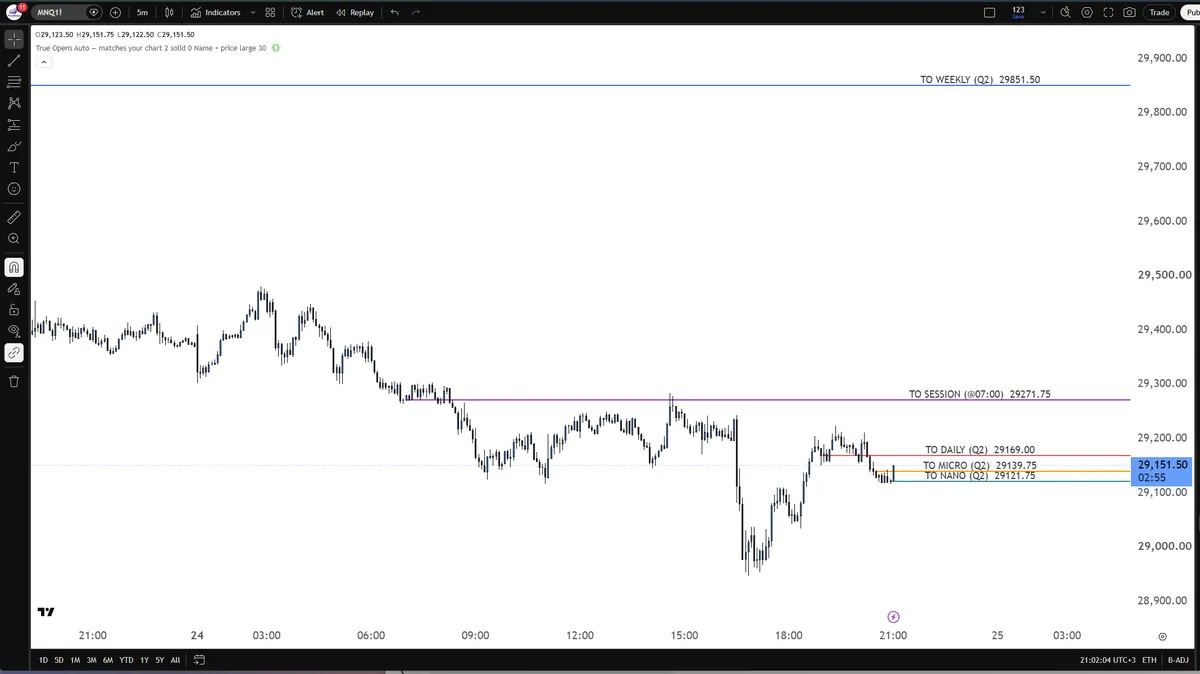
Shows opening prices for different time periods, from daily and weekly windows to shorter ones. These levels provide reference points for analysis.

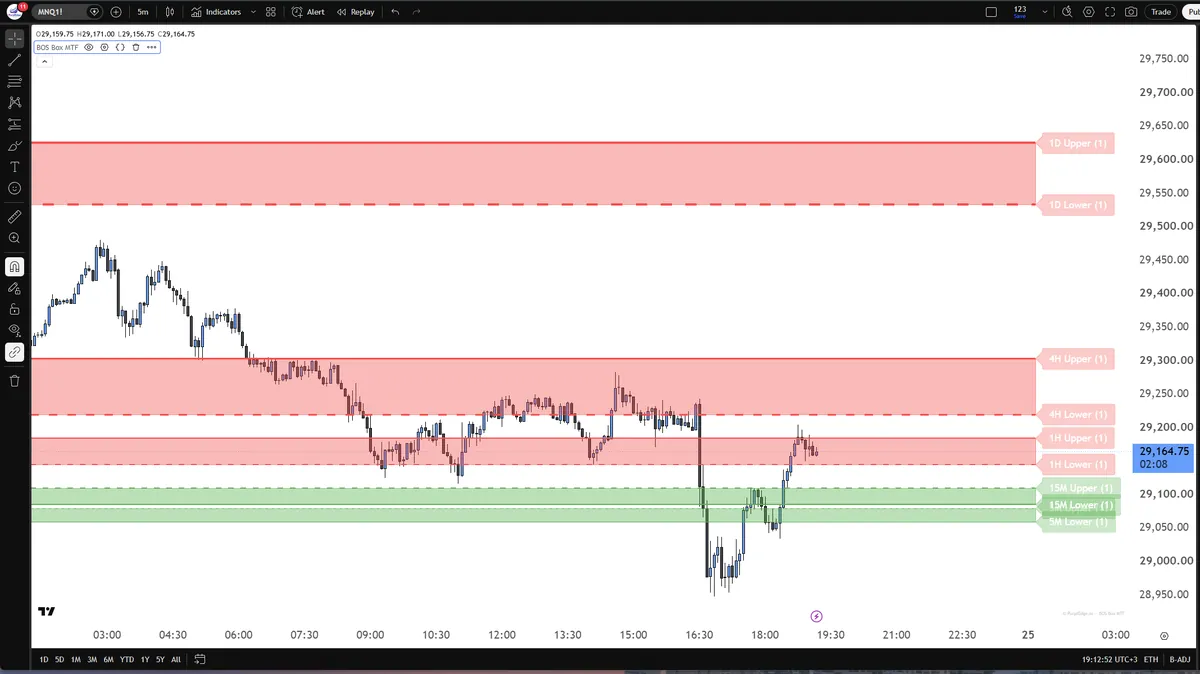
Marks areas where price moves beyond previous highs or lows. The MTF edition brings multiple timeframes onto the same chart.
Displays price gaps formed on higher timeframes, helping you examine levels that can be difficult to spot on a short-term chart alone.
Maps areas the system identifies as imbalances and ranks them by strength and distance from price. They are reference areas for your analysis.
Brings your chosen entry, target and stop levels together with position-sizing calculations. Review the plan against the amount you are prepared to risk before acting.
Helps calculate position size using the risk amount and levels you define. Review your plan consistently as you move between assets.
DCA here means splitting entry into a trade across several stages. Review the size of each stage and the combined risk. Staged entries do not remove risk.

Concise and in-depth analysis, supported by AI, translates system data into scenarios and levels of interest. Annotated charts help you follow the explanation.
Shows how many tracked strategies are long, short or flat. This is exposure within PurplEdge systems, not a measurement of all money in the market or a trading instruction.
These are in development and are not part of the current subscription.
All tools and systems on one screen.
Coming soonTrade from your browser, on any computer.
Coming soonFor supported prop-firm accounts.
Coming soonAsk about the market, in real time.
Coming soonThe tools inside NinjaTrader.
Coming soonFunded accounts only, never personal capital.
Coming soonStart free, learn with the community, and grow when you need to.